Sigma

2024 Week 24 | Sigma: Can you add custom map layers?

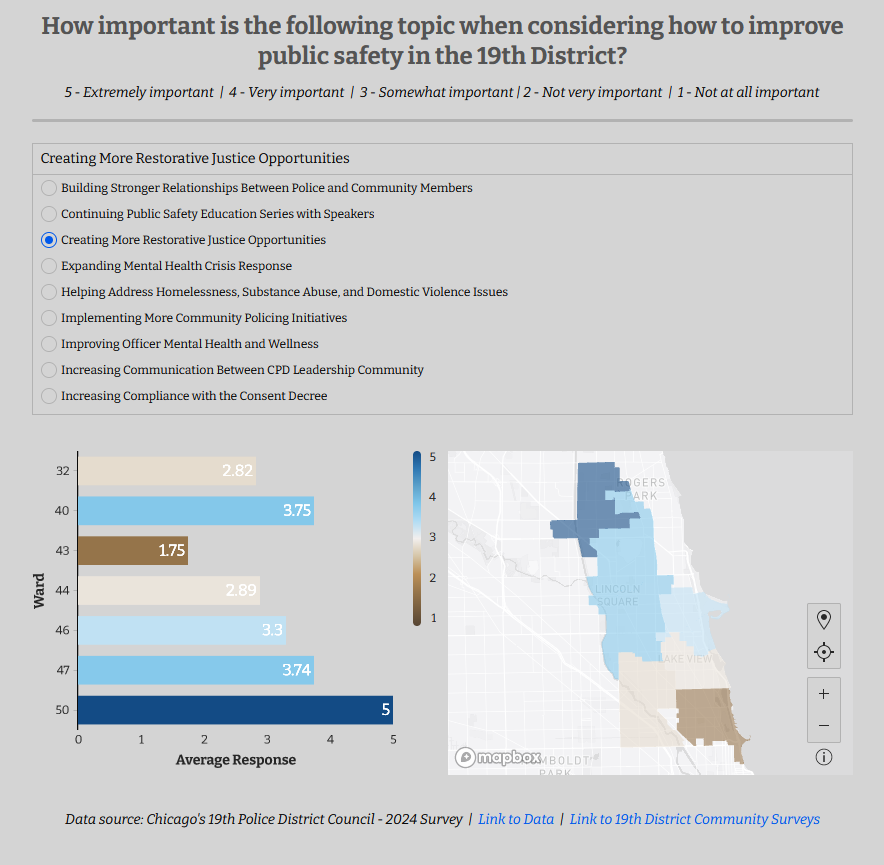
Introduction A few weeks ago, the 19th Police District of Chicago emailed me with some interesting survey data. The visualizations were useful, but they were living inside of a Google Slides presentation, and I wanted to dig deeper into the results. Thankfully, I followed my nose to their community survey website and found that they […]

2024 Week 24 | Sigma: Can you add custom map layers? Read More »

2024 Week 17 | Sigma: Can you Cohort These Customers?

Introduction Welcome to Week Seventeen! This week, you’re going to perform a Cohort Analysis of food truck customers based on when they placed their first order.  Conditional formatting will help highlight which cohorts have a greater percentage of customers in them. As a bonus, you will implement a dynamic page control input to let the

2024 Week 17 | Sigma: Can you Cohort These Customers? Read More »

2024 Week 15 | Sigma: Can you identify the top, average, and bottom profitable customers? 

Introduction This week, we’re building a staple in my bar chart library: Top, Bottom, and Other Values. I often use this bar chart to easily show the breadth of the outliers while not losing sight of the typical. This challenge is also a great example of the flexibility of modeling at different levels of granularity

2024 Week 15 | Sigma: Can you identify the top, average, and bottom profitable customers?  Read More »